
Debugging Thunderbird Using Firefox Developer Tools
 Mike Ratcliffe | October 08, 2013

I recently discovered that it is possible to use Firefox Developer Tools with Thunderbird. Philipp Kewisch has done a fantastic job of his Google Summer of Code 2013 Project to bring Firefox Developer Tools to Thunderbird.
Starting with Thunderbird 24.0a1 and a matching version of Firefox, it is possible to debug Thunderbird code using Firefox Developer Tools. If your version of Thunderbird is 14.x then please go to Help → About Thunderbird and allow it to update.
For best results you should use the latest nightly versions of both Thunderbird and Firefox. At the very least the version numbers should match. Here is how to get things up and running using the latest nightlies:
- Download the latest Thunderbird Nightly.
- Start Thunderbird.
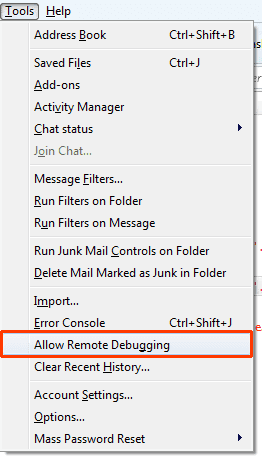
- Select Tools → Allow Remote Debugging.
-
Download the same version of Firefox Nightly as you did Thunderbird.
-
Start Firefox.
-
Press Ctrl → Shift → K to open the toolbox.
-
Click ⚙ to open the developer tools options panel.
-
Check Enable Chrome Debugging and Enable Remote Debugging then click Restart Now if it appears.
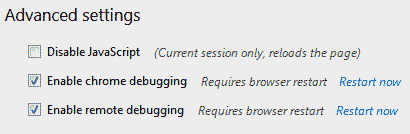
Enable chrome debugging and enable remote debugging options -
Select Web Developer → Connect…
-
Choose localhost port 6000 and click "Connect."
You will be presented with a set of available remote tabs and processes. For me they appeared as follows:
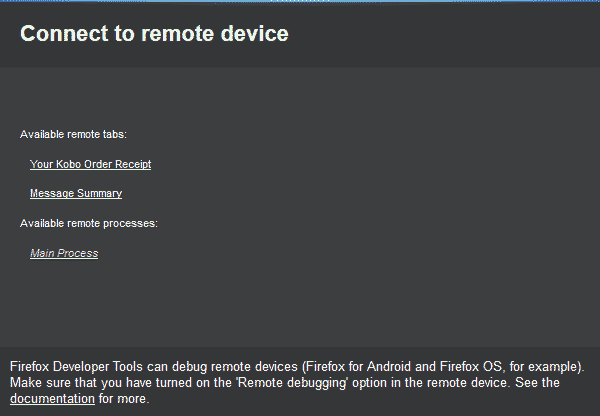
- "Your Kobo Order Receipt" - the area in which the selected email is displayed. In this view the following did / did not work:
- The console tab may work but was empty when I tested.
- The inspector, debugger, style editor and profiler work just fine.
- The network tab was empty.
- "Message Summary" is the area in which email summaries are displayed when multiple messages are selected.
- The console tab may work but was empty when I tested.
- The inspector, debugger, style editor and profiler work just fine.
- The network tab was empty.
- "Main Process" - the main Thunderbird process. In this view the following did / did not work:
- The console, debugger and profiler work fine.
- The inspector and style editor and network tabs were empty.
Although not all of the tools work perfectly in all contexts at least you can now use the DevTools for extension development and to fix bugs.
Philipp has the same code packaged as an extension that could be used to enable the debug server from other XUL apps here.
Something has been needed since Venkman development halted so now we have something there is no excuse, whether it is Thunderbird itself or an extension... go, get hacking!
Written by Mike Ratcliffe who lives and works in England building useful things.