
Firefox Developer Tools Highlighter
 Mike Ratcliffe | October 17, 2013

When it comes to the Firefox Developer Tools Inspector one of our most common requests is that our highlighter should support box model highlighting. We are working on implementing this but before we get into full swing we need to know exactly what you want it to look like and how you would like it to act.
Please take a look at how current tools behave and let us know what you would like our box model highlighting to look and behave.
The examples on this page show the different methods of inspecting this div in Firefox Developer Tools, Firebug, Chrome DevTools and Opera Dragonfly:
-
padding: 10px;
-
border: 10px dashed green;
-
margin: 10px;
Inspection by mousing over content
This is the mode that most people are familiar with. You click the inspect button and move the mouse over the content area to highlight a node.
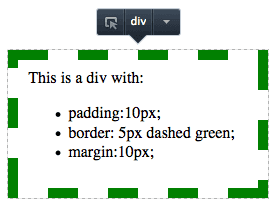
Firefox Developer Tools use a subtle outline around the border of the hovered element. In addition, a node infobar appears. This infobar allows you to set pseudoclasses such as :hover, delete the node, copy HTML etc. This is currently the only highlight mode used by the tools:
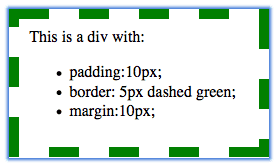
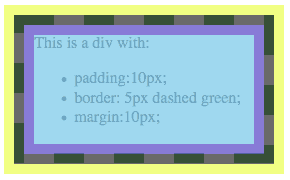
Firebug uses a blue outline:
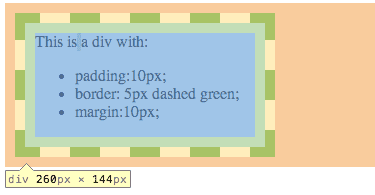
Chrome DevTools highlights content, padding, border and margin areas even when inspecting via the mouse. They also display simple node information e.g. node name, width and height:
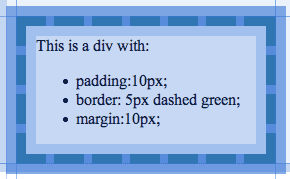
Opera Dragonfly also highlights content, padding, border and margin areas even when inspecting via the mouse. In addition it shows guides outlining the border of the element:
Inspection by mousing over the layout (box model) panel
Firebug brings out the big guns here and highlights all of the different layout components. It also outlines the node's active container in a dashed red line and adds rulers to it (useful for absolutely positioned elements). In case this is not enough it adds guides around the section being hovered (content, border etc.):
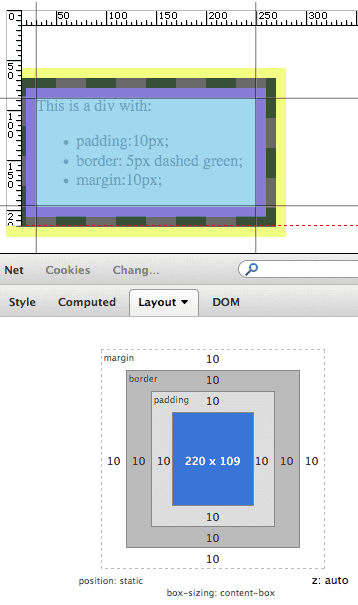
Chrome DevTools highlights only the content, padding, border or margin depending on which is being hovered:
Inspection by mousing over the nodes in the Markup (HTML) panel
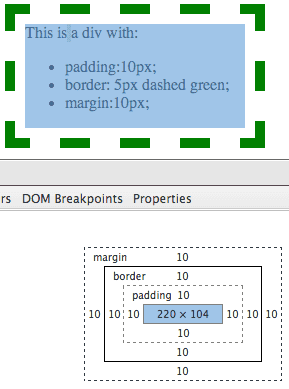
Firebug shows the box model (content, padding, border and margin):
Chrome DevTools and Opera Dragonfly act exactly the same as when mousing over content.
So the question is what would you like the Firefox Developer Tools highlighter to look like and how should it act in each of the situations above. It doesn't need to act like any other highlighter so be creative!
Written by Mike Ratcliffe who lives and works in England building useful things.